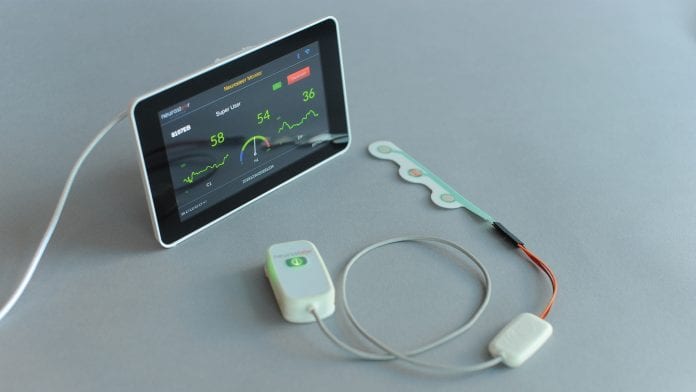
Neurosteer has developed a three-electrode neurological monitor that provides multiple brain activity biomarkers.
Neurosteer has the mission to improve the quality of brain disorder care by creating meaningful and easy-to-use brain activity measures that provide immediate neurofeedback as well as general brain activity assessment. The company produces high-level brain activity biomarkers in real time which enable treatment improvement by affordable and continuous monitoring of neural activity.
The mobile monitor can be used next to a hospital bed or at home and provides assessment and monitoring, with real-time alerts.
The activity of the brain
Automatic and accurate brain monitoring is key for optimised treatment both in the clinic and at home. For example, in the Intensive Care Unit (ICU), it can help prevent secondary trauma due to epilepsy or oedema, and in the operating room, it can reduce post-operative cognitive decline. Similarly, monitoring of home-care patients can indicate drug compliance and effectiveness, and provide a general indication of neural activity without the presence of a neurologist.
The current focus of Neurosteer is neurodegenerative diseases and mood disorders, as well as various forms of epilepsy, and the main effort is devoted to assisting with drug development and neurostimulation optimisation. For clinical trials and preventive medicine, Neurosteer can provide affordable patient screening and monitoring as well as quantification of the response to neurological and psychiatric drugs.
The system uses proprietary, real-time algorithms which run on the cloud and produce biomarkers that can be read using any web interface. The biomarkers are associated with various forms of cognitive load, emotional states, stress, pain, abnormal (epileptic) activity, disorders of consciousness, sleep stages and level of anaesthesia. Importantly, the biomarkers do not require electroencephalography (EEG) expert interpretation, thereby saving time and reducing costs. Objective statistics, trends and historical data are available for a single patient or a group of patients. The historical data can be easily integrated with other analytics tools used for better trial management.
About Neurosteer
Neurosteer’s core technology was developed at Tel Aviv University, Israel, by co-founder and CEO Nathan Intrator. Intrator received a PhD in applied mathematics from Brown University, US, and is a professor (on leave) of computer science and neuroscience at Tel Aviv University. He studied the signal-processing capabilities of sonar animals and developed signal-processing methods for brain activity interpretation and brain-computer interfaces, most notably for extensive information extraction from a single EEG channel. Neurosteer commercialises this technology to provide mobile brain analysis with medical and wellness applications.
Neurosteer has already helped a number of patients and their families – specifically, assisting caregivers in their assessment and providing a clear response to physical and other stimulation. In addition, the system is being used for assessment of Parkinson’s disease and frontotemporal dementia (FTD) patients. Moreover, the system provides indication of the response to transcranial direct current stimulation (tDCS) and deep brain stimulation (DBS).
Main novelty
The main novelty is a medical-grade brain activity monitor which relies on a single EEG channel and produces unique brain activity biomarkers. This is enabled by advanced mathematical signal processing and sensitive electronics. This makes the Neurosteer system wearable, affordable and very easy to operate. In particular, it addresses the demand for continuous neurological bedside monitoring and at-home monitoring.
Neurosteer utilises signal processing and machine learning to produce neurological biomarkers. The real-time analysis can provide timely alerts and neurofeedback. This enables personalised drug and neurostimulation intervention. The current version of the product provides five different cognitive biomarkers for assessment of FTD, Parkinson’s and Alzheimer’s disease. It also provides automatic indication of pre-ictal and epileptic seizure activity which is being validated in clinical trials with leading researchers in the field.
The small size and ease of use make the sensor a natural companion in CNS clinical trials as well as neurostimulation development and validation studies. The system can provide affordable patient screening and reduce the need for costly assessment methods such as functional magnetic resonance imaging (fMRI). It can shorten the processing time of the results since the interpretation is done automatically and doesn’t require expert technicians. As the monitoring works inside and outside of the clinic, it can ensure patient compliance and can thus be the missing piece to improve clinical study outcomes, especially in neurodegenerative diseases.
High demand for brain monitoring and assessment
In the US, one out of seven people above 70 years old suffers from Alzheimer’s, Parkinson’s or dementia. Such high prevalence inflicts a tremendous burden on society. This prevalence is likely to rise as life expectancy increases and, since no cure is in sight, the expected costs are prohibitive. There is some hope in reducing the progression rate of the disease by lifestyle changes, brain stimulation and drugs. To achieve that, efficient and affordable ways for early screening methods must be developed. However, in order for preventive medicine to work optimally, personalised factors and disease progress should be considered when giving the treatment. That is, for optimal intervention, the system should be able to screen for early symptoms but also to monitor each patient continuously and assess progress.
Neurosteer has developed a platform for effective assessment and early screening of Parkinson’s disease and FTD. This platform can be used in small clinics or at home and is far more affordable than current methods based on advanced MRI and positron emission tomography (PET). The medical-grade monitoring can also help in the quest for the development of new drugs and other interventions such as invasive and noninvasive brain stimulation, food supplements and vitamins, or diet and lifestyle changes. In particular, it can provide affordable screening and monitoring for pharma companies, assisting in research and improving the success rates of clinical trials. Furthermore, as DBS is becoming a frequent method for alleviating some of the cognitive and motor symptoms of Parkinson’s disease, Neurosteer’s technology can optimise and individualise specific pattern parameters of the stimulation.
Principle of operation
General scheme of the system
The standard approach in clinical EEG is to record brain activity using multiple electrodes. Multi-electrode EEG is reminiscent of recording an orchestra via multiple microphones, one next to each musical instrument or a family of musical instruments. However, humans can listen to a full orchestra with a single ear and decompose the different musical instruments in the auditory cortex. That is, we can hear each musical instrument separately, although we hear all of them together. Similarly, it is possible to look at the different neural networks in the brain as different families of musical instruments, joining in a large orchestra. Henry Markram, the initiator of the Human Brain Project, called it a “million-note grand piano”.
The separation of different ‘musical instruments’ in the brain cannot be based solely on frequency information. For example, while frequency can be used to separate the drum from the trumpet, it cannot be used to separate the trumpet from the violin, as they both have the same base frequency. The separation in this case has to rely on higher order formants of the sound, also referred to as the colour of the music or timbre. These can be separated by a more refined time/frequency analysis of the signal, based on harmonic analysis theory. In the brain, various functional neural networks (for example, the limbic versus the thalamic network) have different characteristics such as the location on the cortical sheet, the topology, type of neurons and length of fibres. These characteristics affect the oscillations of each network in a way that enables the separation between them using advanced harmonic analysis.
Neurosteer has developed signal processing and data analytics tools that can separate different functional neural networks from a single EEG channel. The system is composed of hardware and software modules that facilitate the capture and interpretation of electrophysiological data as well as the viewing of the processed data in real time and offline.
An electrode patch is located on the subject’s forehead to capture the electrophysiological signal. The signal is sent via low-energy Bluetooth to an EEG router (monitor or Android app). The signal is then sent via Wi-Fi to the cloud where the data is stored on a HIPAA-compliant server. Data analysis performed in the cloud transforms the electrophysiological signal into readable data of brain activity, which is accessible via a web interface. The brain activity features (BAFs), which comprise the main novelty of the method, are created using a variant of the wavelet packet analysis and the best basis algorithm.1,2 The full details of the algorithms are described in US patents.3,4
Details of the BAF representation
The resulting BAF includes specific groups of features that are associated with specific tasks, functional neural networks or brain states. Fig. 1 indicates the general division of the map into specific functional groups. Most brain activity representations such as PET, computed tomography (CT), electromyography (EMG) and fMRI organise the processed data in a geographic manner (namely, proximal voxels represent proximal brain areas).
In contrast, the Neurosteer representation is functional (namely, proximal BAFs are close in brain functionality). This makes the map easier to read and leads to feature regions which are associated with specific brain states. Fig. 1 provides a crude division to specific functional regions. The cognitive region A will be further subdivided below.
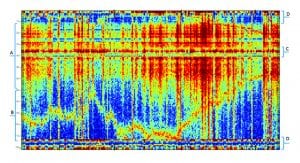
The emotional region (B)
This region, which appears to be associated with limbic system functions, includes rows 70-110 in the graph. It represents features that are active as a response to emotional stimulation, e.g. while watching a movie or listening to your favourite music. The biomarker E2 is correlated to activity in this region.
The executive region (C)
This region includes rows 35-40 in the graph. It appears to be more active when subjects are engaged in decision making. It is also active during sleep and during anaesthesia. It may be active in some types of meditation and not in others. In general, activity in this region appears to be missing (or diminished) in subjects that are in a coma. The biomarker C4 relates to activity in this region.
The stress regions (D)
This region includes rows 1-10 and 110-121 in the graph. This area is associated with stress, pain, reward, excitement and anxiety. The differences between these brain states in the BAF plot representation are small but can be noticeable with an AI-based predictor.
The cognitive region (A)
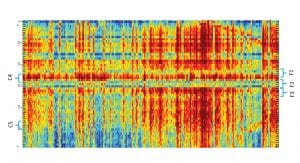
This region includes rows 10-70 in the graph. Our main effort is focused on this region. It is subdivided into smaller strips as indicated by Fig. 2, each representing a different aspect of cognitive activity. These areas were defined following studies using multiple cognitive tasks as well as recordings of multiple brain disorders. The cognitive indications include:
- Patterns of activity induced by passive (e.g. listening) versus active (e.g. calculating) actions
- A sub-functionality division into short-term and long-term memory activation biomarkers
- Region C4 is associated with medial-prefrontal activity
- C5 is associated with differentiating between anaesthetised and awake subjects. Moreover, it appears to be highly correlated with the difference between two types of anaesthesia (volatile and TIVA)
- Regions F1 and F2 are most sensitive to stimulation of the frontal lobe via tDCS
- Region F3 is another area indicating frontal lobe activity that appears to be less correlated with medial prefrontal activity
- The combination of F1, F2, F3 and C4 is helpful in detecting frontal lobe dysfunction related to various neurodegenerative disorders.
Biomarkers validation
The BAF map described above provides an initial (raw) brain activity representation. It is based on advanced harmonic analysis and decomposes a single EEG channel into meaningful brain activity components.
This representation was created from a large cohort of subjects performing multiple cognitive and emotional tasks. Applying deep learning and AI on top of this representation creates the different biomarkers. Specifically, the biomarkers that are discussed here can separate between different cognitive tasks and give indications on effectiveness of intervention using different drugs.
Cognitive biomarker validation
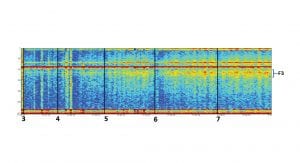
Here, the cognitive biomarker F3 is being correlated with the cognitive load of well-established working memory assignments. These investigations include, for instance, the digit span assignment, in which subjects are asked to memorise a number of digits and then repeat the digits memorised. This is a well-known working memory task in which the cognitive load is manipulated by changing the number of digits to memorise, thereby also controlling the level of the task. Fig. 3 shows the increase in activity of the cognitive biomarker F3 as a factor of the task level – that is, the number of digits memorised. Using the same task and other ones, we are also investigating the effect of brain stimulation methods such as tDCS.
Biomarker C5 has been tested in multiple tasks to demonstrate its consistency and relevance to different cognitive tasks. Fig. 4 summarises four different studies which compare the cognitive biomarker C5 and an emotional biomarker to bandwidth frequencies commonly used in EEG analysis, Delta, Theta, Alpha and Beta. It is evident that the cognitive biomarker is consistently stronger and more significant in separation between the different tasks.

Specific applications
With the Neurosteer system it is possible to assess brain activity during natural tasks, which may include cognitive, emotional or physical challenges. In particular, the ability to monitor patients that are performing multiple cognitive challenges provides valuable information about their cognitive condition. Similarly, variable response to stimulation and drug intervention can provide clear indication to the effect of the intervention.
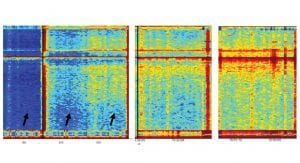
Fig. 5 provides an indication of a specific brain activity pattern that is observed in Parkinson’s disease patients while performing a specific balancing task. The black arrows indicate the performance of that task in four different patients. It is clear that the two patients in the top panel have a different activity compared to the two patients in the bottom panel. Preliminary results indicate that the pattern of activity that resembles the bottom panel is an indication to a more severe case of Parkinson’s.
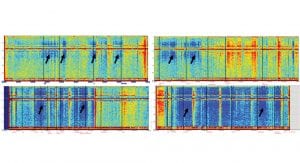
The effect of cognitive stimuli on cognitive BAFs
Fig. 6 demonstrates the effect of progressive cognitive stimuli on the four cognitive biomarkers mentioned above: C4, F1, F2 and F3. To remove doubt, the names have no connection to electrode locations. Stronger activity of a specific biomarker is indicated by a redder signal in the colour-heat map. It is easy to see that each of the biomarkers becomes stronger with time (that is, as we go from left to right).
A careful examination also shows that the biomarkers are independent of each other, with some degree of correlation between them. Specifically, the right two panels indicate activity during a memory cognitive task of one minute before and after ten minutes of frontal lobe tDCS stimulation on healthy subjects.
References
- Coifman, Ronald R, and M Victor Wickerhauser. Entropy-based algorithms for best basis selection. IEEE Transactions on information theory 38.2 (1992): 713-718
- Nicola N, Intrator N. An adaptive approach to wavelet filters design. Neural Networks for Signal Processing. Proceedings of the 2002 12th IEEE Workshop on IEEE. September 2002
- Systems and methods for brain activity interpretation. Patent number US20160235351A1
- Systems and methods for analyzing brain activity and applications thereof. Patent number US20170347906A1
Nathan Intrator
Co-founder and CEO
Neurosteer Ltd
+972 544 650 365
info@neurosteer.com
www.facebook.com/Neurosteer/
www.neurosteer.com
This article will appear in issue 7 of Health Europa Quarterly, which will be published in November 2018.